A Hybrid Neural Network for Airbnb Demand

Google Colab notebook: Open the hybrid Airbnb demand notebook · Raw Notebook: Download .ipynb
I wanted to find out whether combining text, location context and ordinary listing details could predict Airbnb demand more effectively than structured data alone. I tested this using the Airbnb NYC 2019 dataset, with 48,884 listings remaining after invalid rows were removed. For this experiment, I defined “high demand” as at least 1.58 reviews per month, the upper quartile of the dataset. This is a proxy for demand rather than a measure of confirmed bookings or occupancy, so the results should be interpreted as predictions of review activity.
How the hybrid model works
I used a leakage-aware stacking design with a held-out test set of 9,777 listings. I then split the remaining data into 19,553 rows for training two auxiliary models and a separate 19,554 rows for training the final classifier. This separation ensures that the final network does not learn from auxiliary predictions made on data those models have already seen.
The first branch uses a listing’s name, host name and neighbourhood text to estimate the probability of positive sentiment. An embedding layer and LSTM learn to reproduce VADER’s positive-versus-non-positive sentiment labels. This captures patterns in the listing metadata rather than sentiment from guest reviews. The second branch extracts a 32-by-32 greyscale map patch around each listing’s coordinates, which a small convolutional network converts into a spatial demand probability.
The final classifier combines these two probabilities with log price, minimum nights, availability, latitude and longitude, host listing count, neighbourhood group and room type. After standardisation and one-hot encoding, the data passes through a neural network with 64-unit and 32-unit hidden layers. I used the same architecture, data split and random seed for the baseline, leaving out only the two auxiliary probabilities so that the comparison remained fair.
What the results show
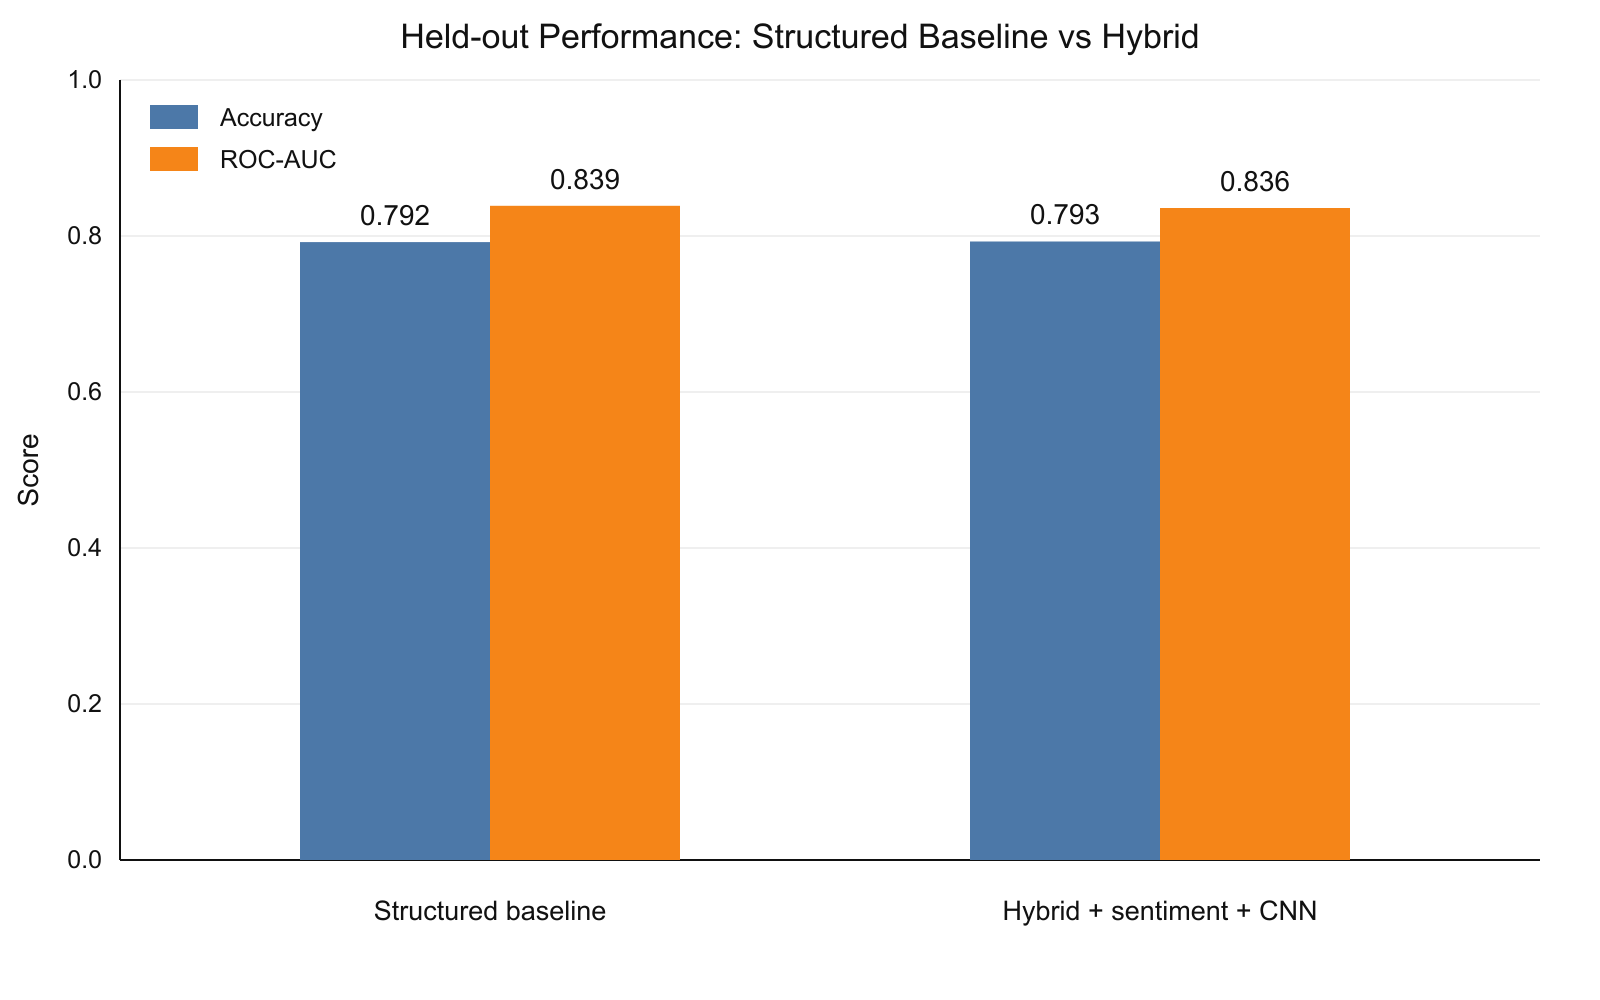
Adding the text and map branches did not produce a clear overall improvement. The structured baseline achieved 0.7922 accuracy and 0.8387 ROC-AUC, while the latest hybrid evaluation reached 0.7930 accuracy and 0.8359 ROC-AUC. The hybrid gained less than one-tenth of a percentage point in accuracy but scored slightly lower on ROC-AUC. The map CNN also produced probabilities clustered around 0.5, suggesting that the static map patches added little beyond the latitude, longitude and neighbourhood information already included in the structured data.
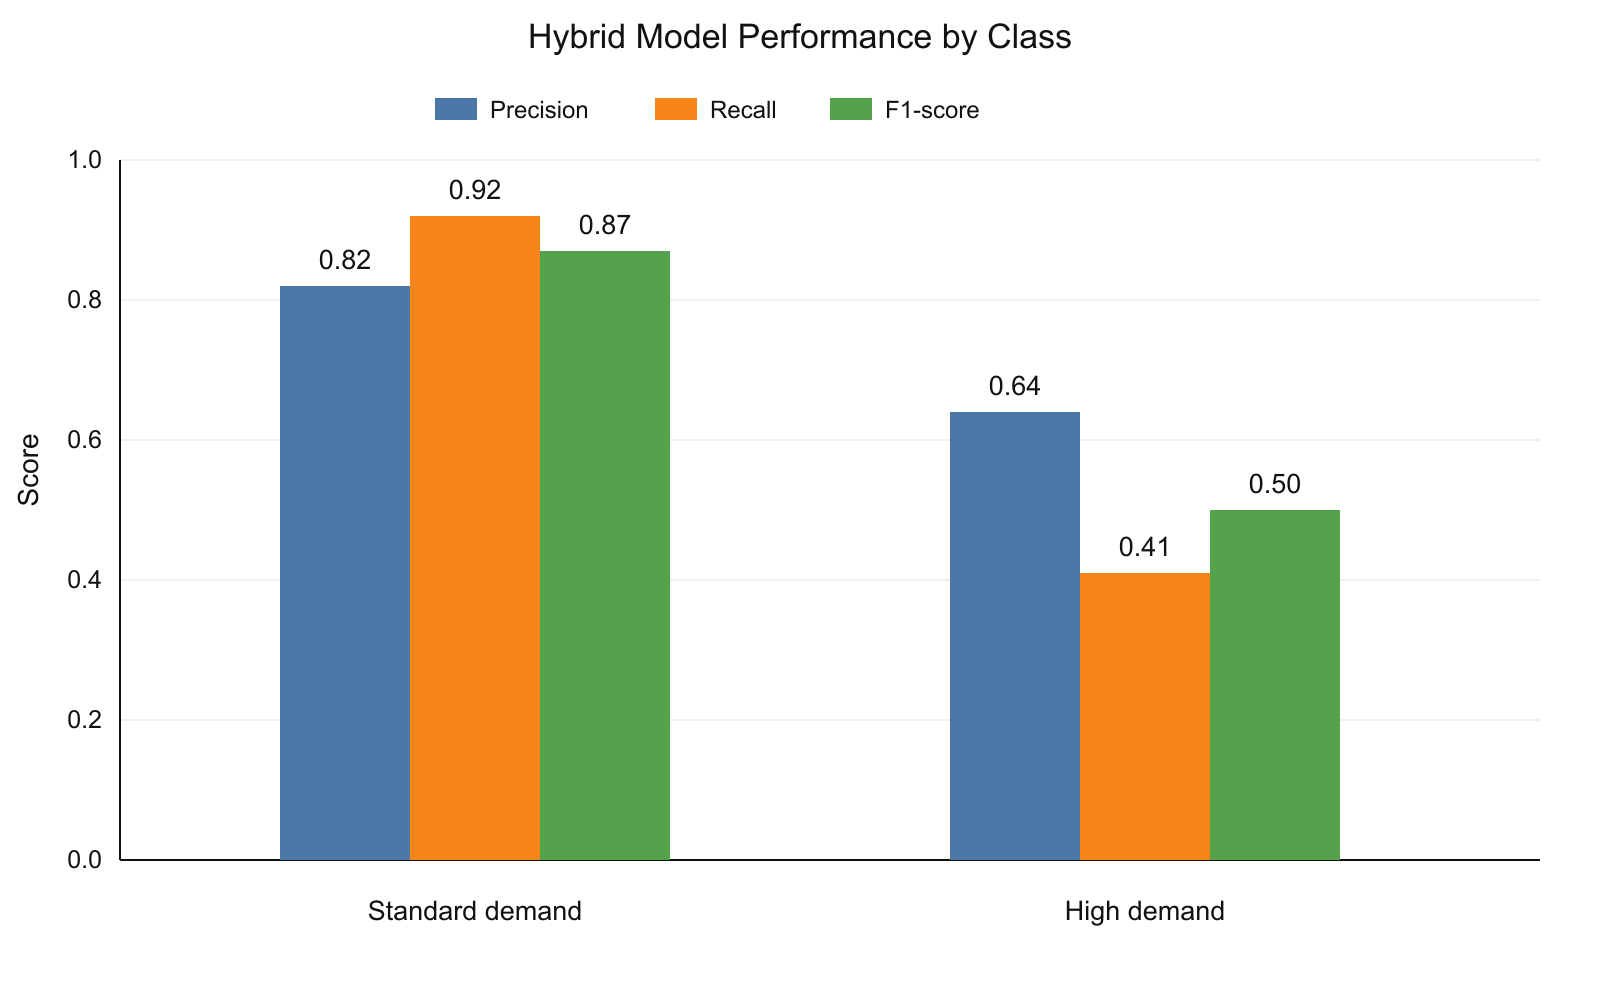
At the default threshold of 0.5, the hybrid model’s precision, recall and F1-score were 0.64, 0.41 and 0.50 for high-demand listings, compared with 0.82, 0.92 and 0.87 for standard-demand listings. Its overall accuracy therefore hides much weaker performance on the minority class. If the model were being used to find as many high-demand listings as possible, I would consider a lower threshold, class-specific error costs and precision-recall analysis rather than solely relying on accuracy.
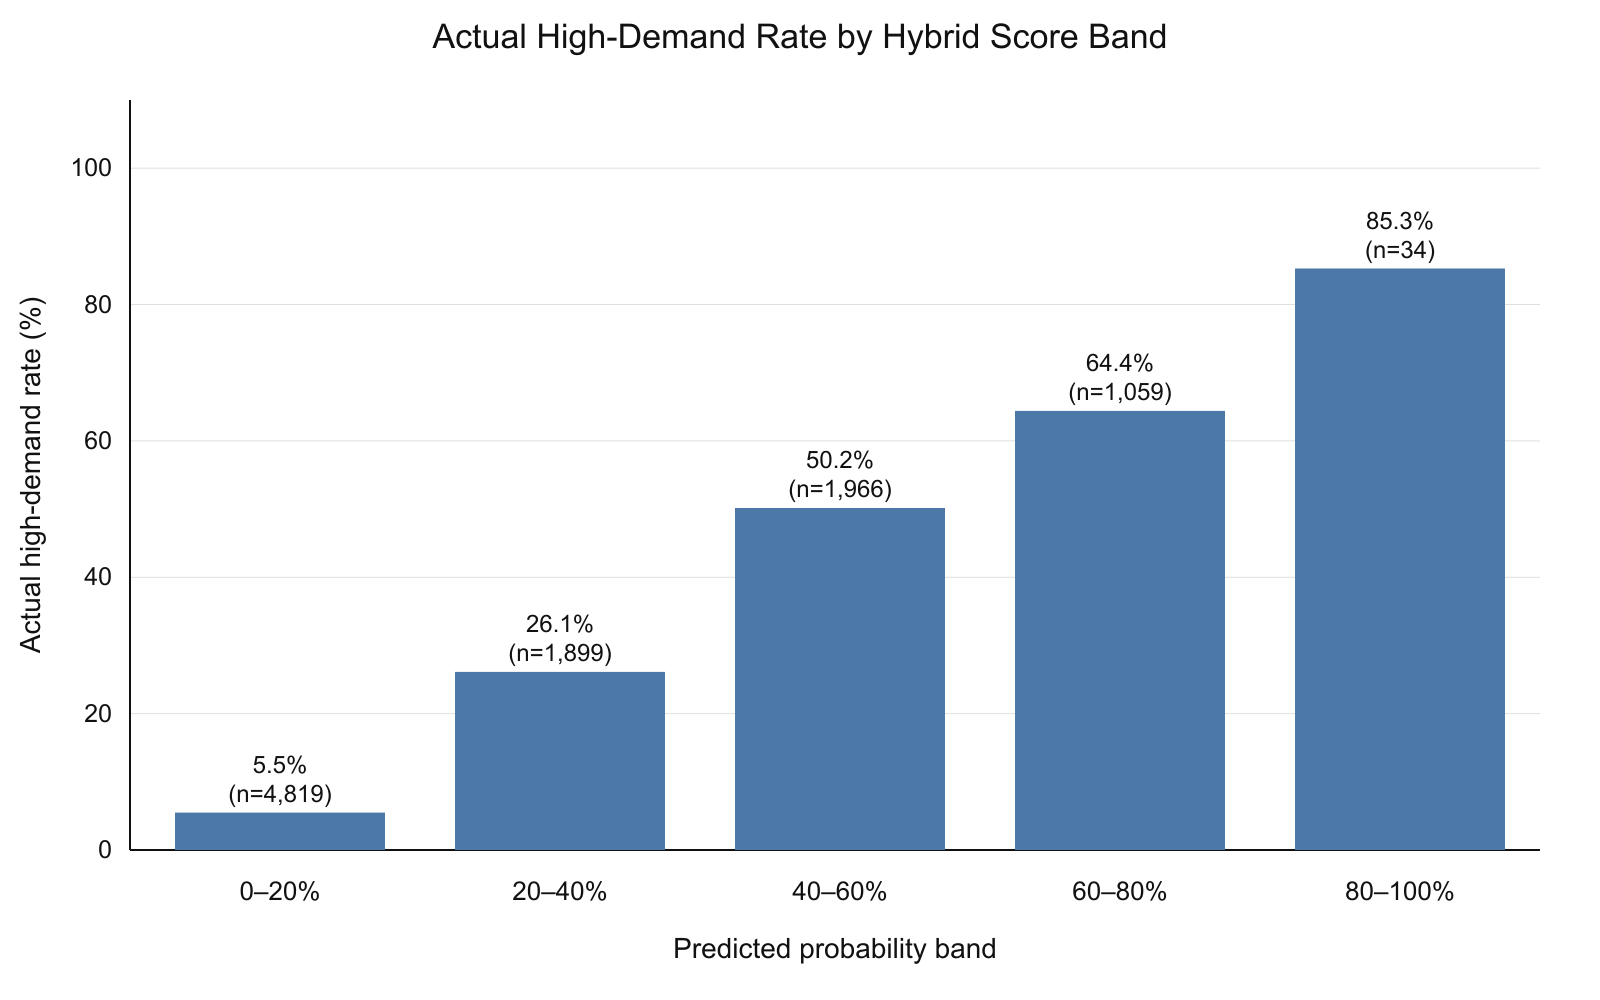
Even so, the probabilities still provide a useful ranking. The observed high-demand rate rises from 5.5% in the 0–20% prediction band to 85.3% in the 80–100% band. The top band contains only 34 listings, however, so its rate is based on a small sample, and this chart alone is not enough to show that the probabilities are well calibrated.
Takeaway
The hybrid architecture worked as intended, but the experiment did not justify its extra complexity. The sentiment branch learns from a proxy label, while the map branch overlaps with location features already available to the structured model. In this case, I would choose the structured model because its accuracy is effectively the same, its ROC-AUC is slightly stronger and it is easier to maintain. A more promising follow-up would be to test genuinely complementary inputs such as guest-review text, amenities, listing photographs or travel-time features.